T2D Risk Screener
A calibrated diabetes pre-screening tool built on Korean national health data — flags patients who need an FPG test before they know they need one.
At a Glance
- Domain: Clinical/healthcare ML — trained on Korean NHIS public health examination data (~1M patients)
- Role: Solo project, CDS 403 portfolio, Spring 2026
- Stack: Python, CatBoost, scikit-learn, SHAP, FastAPI, Pydantic v2, vanilla JS + Plotly
- Headline metric: ROC-AUC 0.816 | sensitivity ≥ 85% at operating threshold
- Status: Complete — live demo at tysonjohnson.dev/t2d
Problem / Context
An estimated 30–40% of people with Type 2 Diabetes are undiagnosed at any given time. The Korean National Health Insurance Service (NHIS) runs annual general health examinations for roughly 1 million adult subscribers, collecting routine vitals, body composition, and optional lab panels. Most of that data never triggers a diabetes referral unless a clinician notices a single abnormal value. The opportunity is to use the full signal in a routine exam — waist-to-height ratio, blood pressure trajectory, liver enzymes, lipid ratios, kidney markers — to surface the patients most likely to have undiagnosed T2D and flag them for a confirmatory fasting plasma glucose (FPG) or HbA1c test. Training on Korean NHIS data specifically means the features, reference ranges, and population characteristics reflect the actual patient pool that IQVIA Korea, hospital analytics teams, and public-health screening programs work with.
Approach
I ingested the publicly released 2024 NHIS General Health Examination CSV (~91 MB, ~1M rows) and engineered 40 features from the raw exam fields: derived body-composition indices (BMI, waist-to-height ratio, weight-adjusted waist index), hemodynamic composites (pulse pressure, mean arterial pressure), liver-function ratios (AST/ALT), log-transforms of right-skewed lab values (GGT, triglycerides, liver enzymes), and full lipid-panel ratios. Binary missingness flags were added for each optional lab so the model could learn from absence as well as value.
The dataset is class-imbalanced: roughly 7.9% positive (~12:1 ratio). I used stratified 60/20/20 splits and applied inverse class-frequency weighting inside CatBoost rather than resampling, which keeps the calibration target honest.
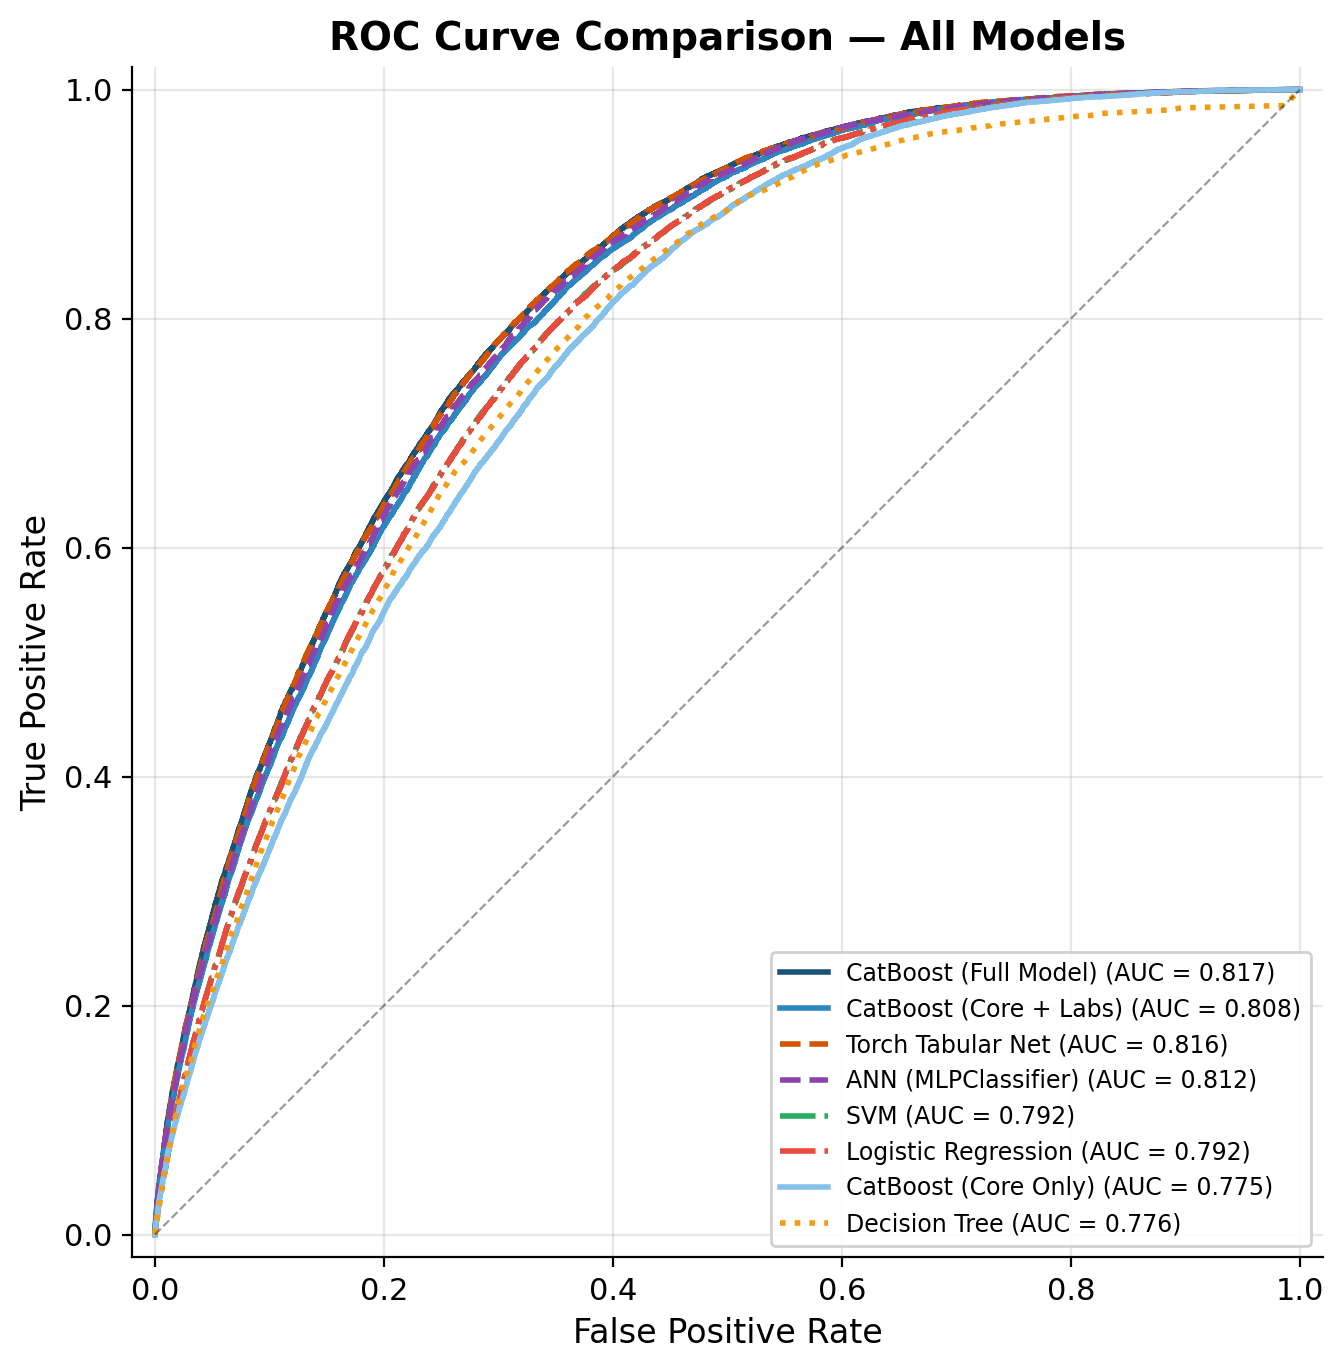
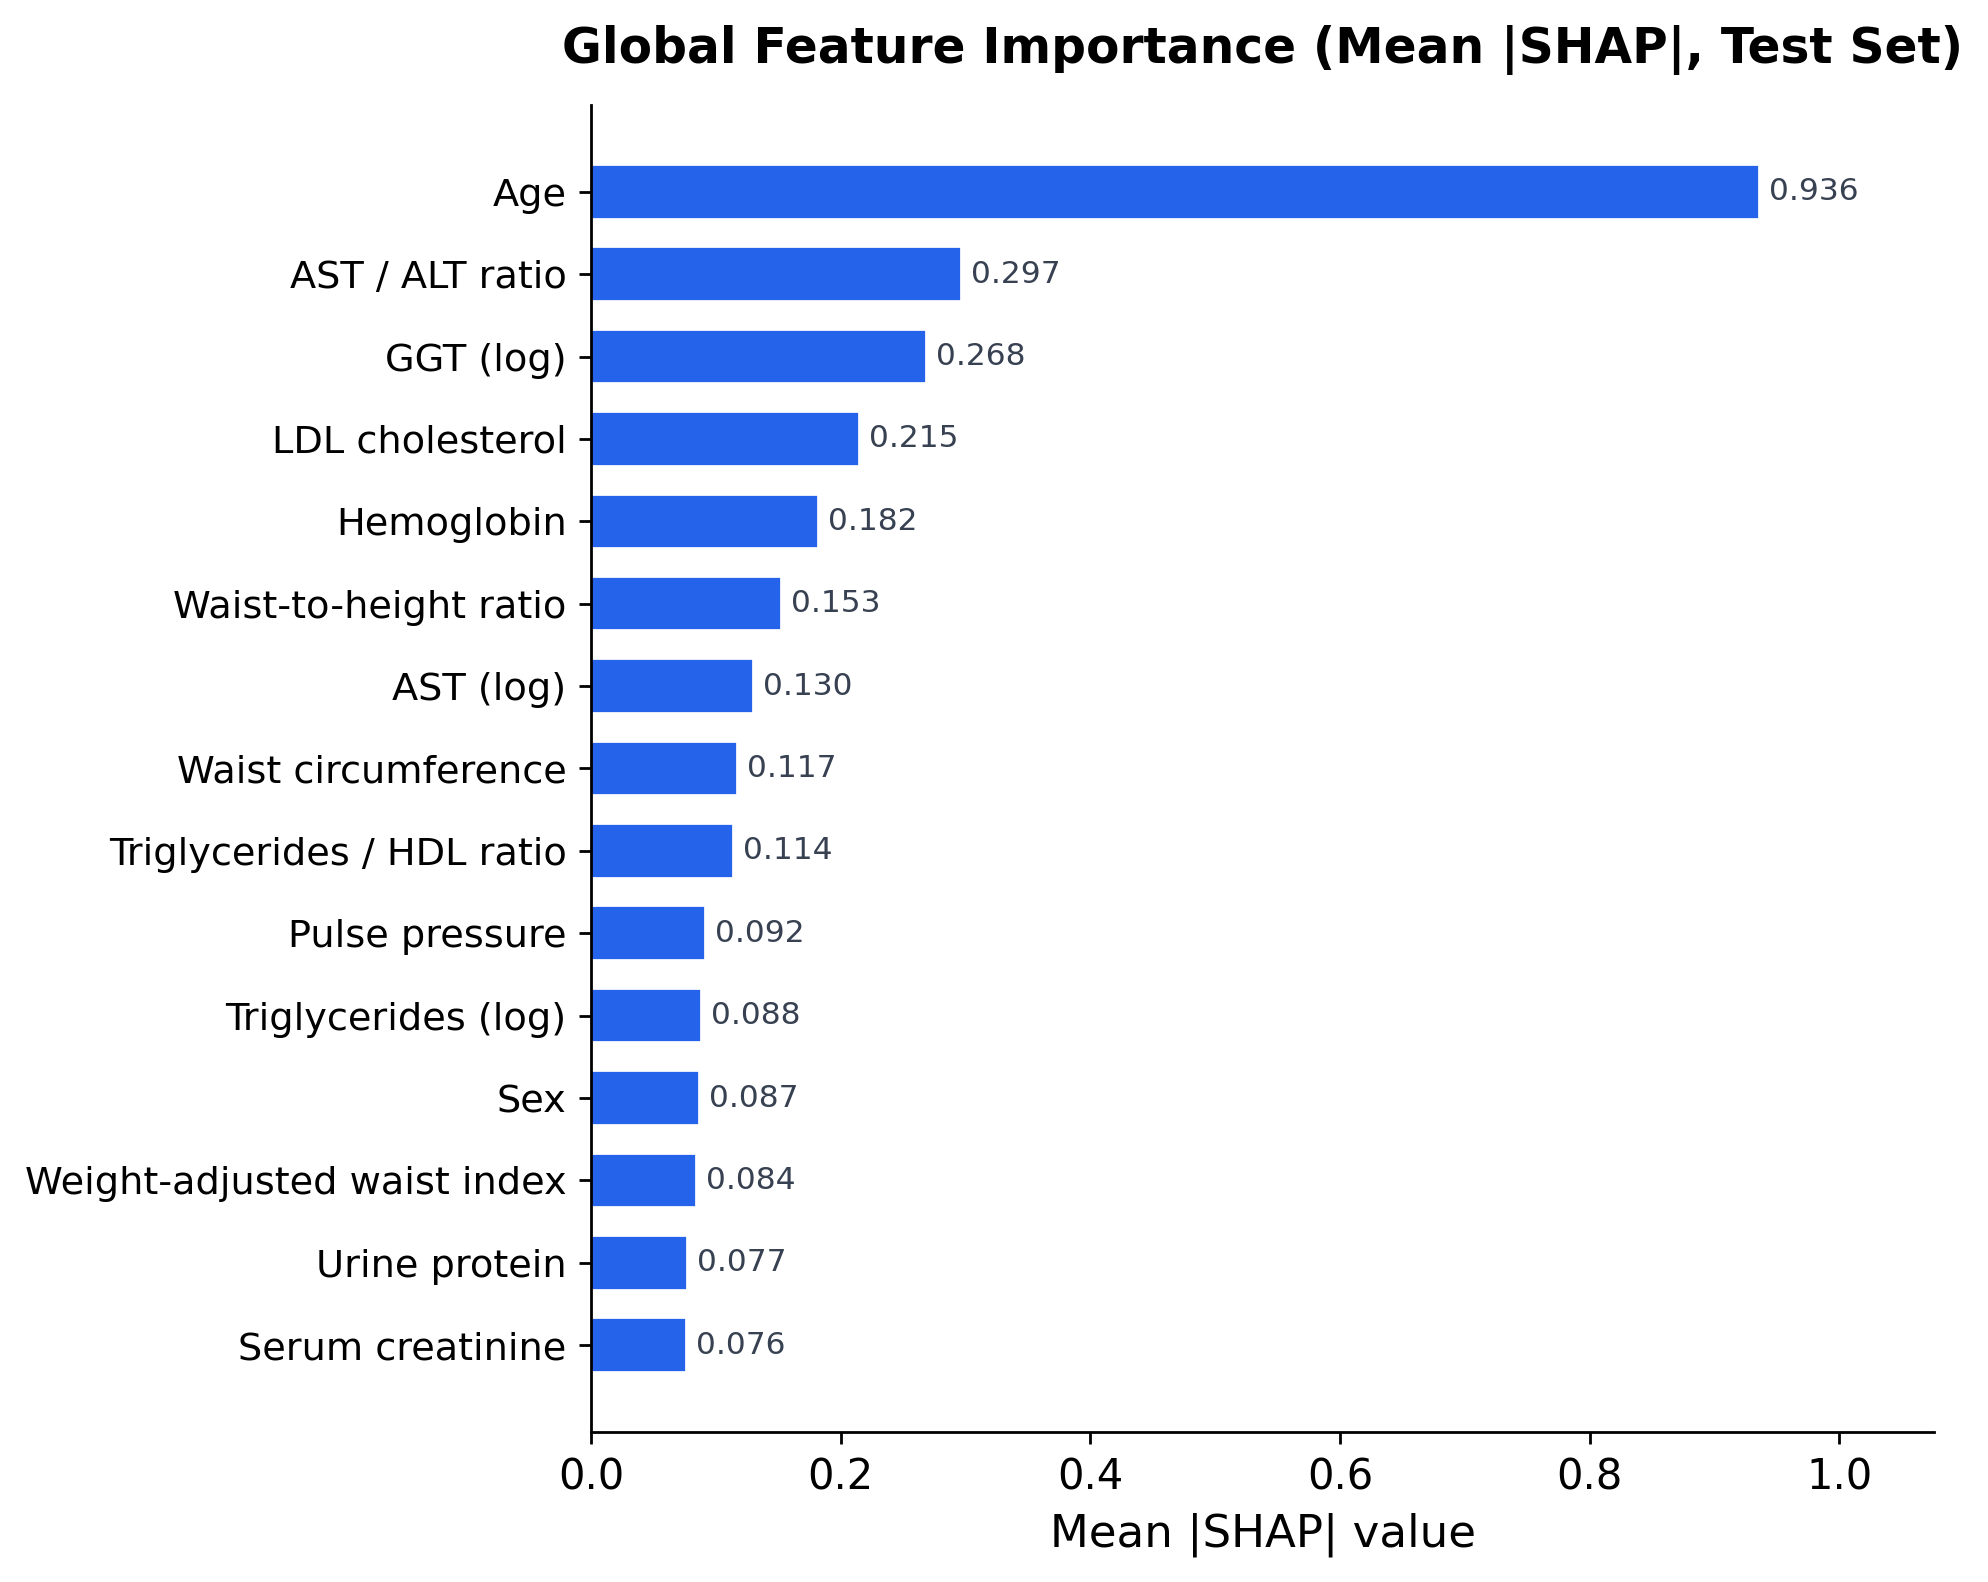
Six candidate models were evaluated on the same held-out test split — CatBoost, a PyTorch Tabular Net, an sklearn MLP, Logistic Regression, SVM (RBF), and a Decision Tree. CatBoost and the Tabular Net finished effectively tied on ROC-AUC (0.817 vs. 0.816), but I chose CatBoost because it computes exact, fast per-prediction SHAP values natively. For a clinical screening tool, every positive screen needs a transparent explanation of which inputs drove it; computing equivalent SHAP for the deep network would have required a slower surrogate (KernelSHAP). CatBoost also runs on CPU at negligible cost, removing any GPU dependency from deployment.
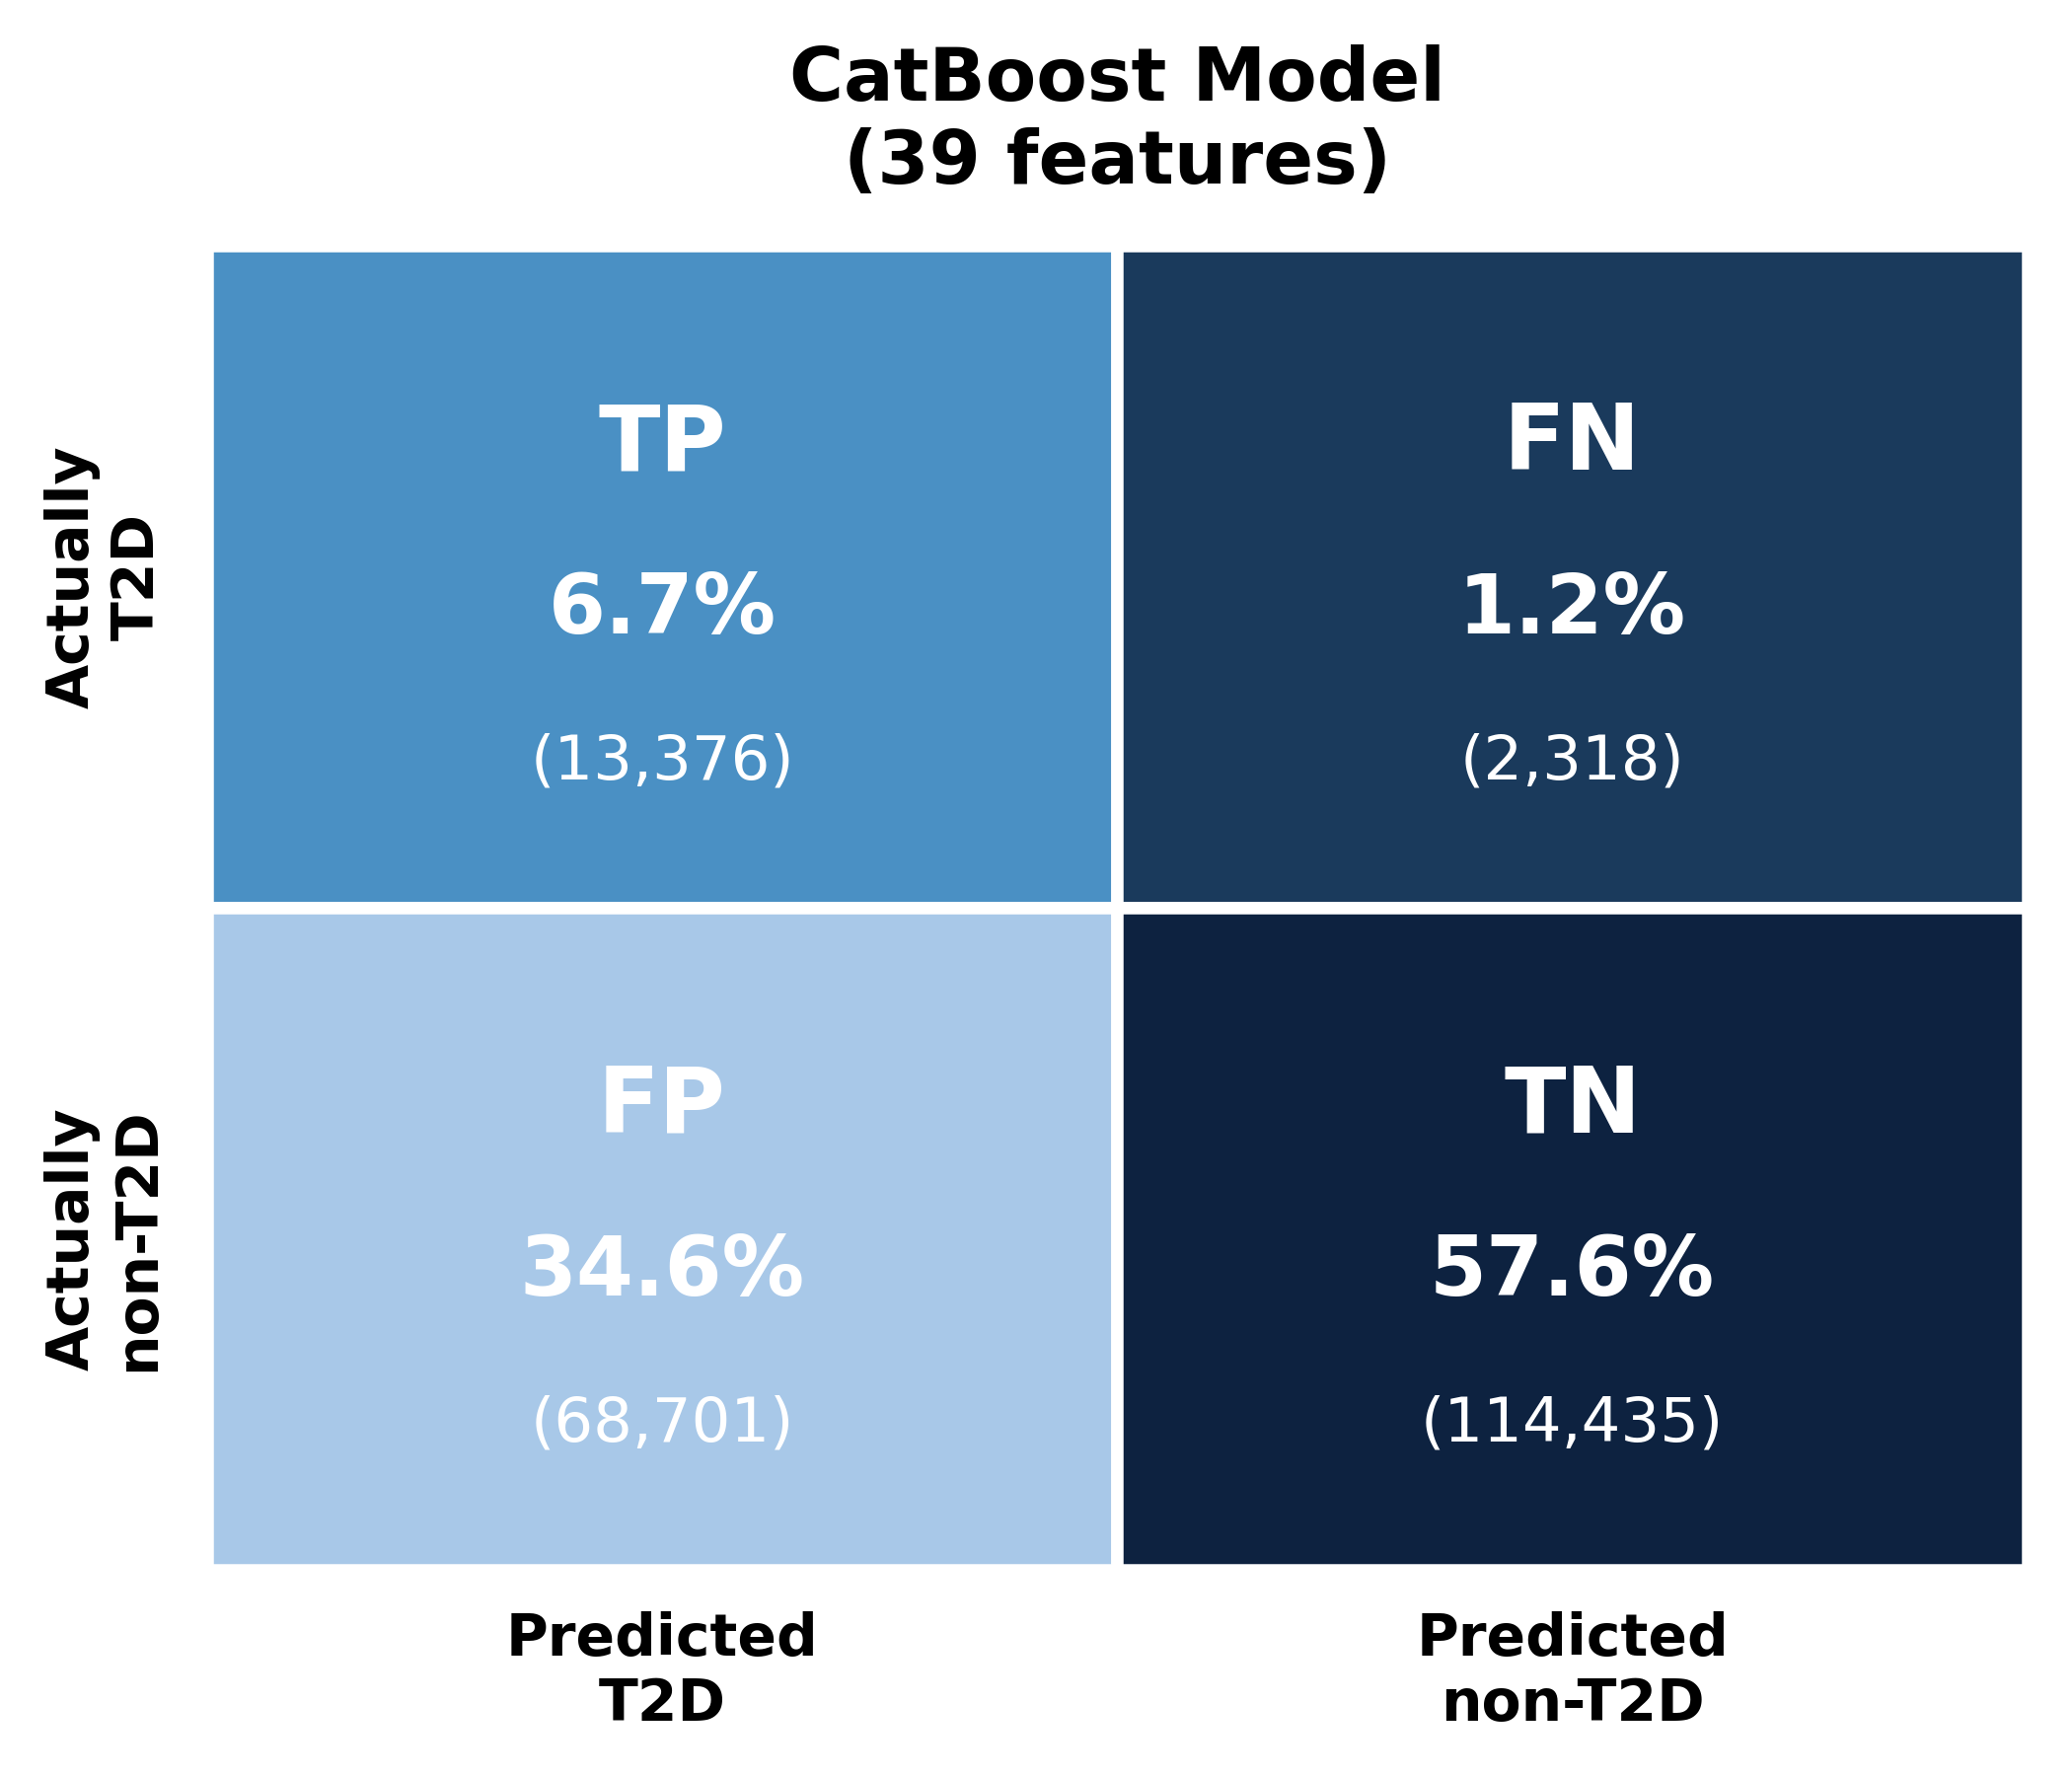
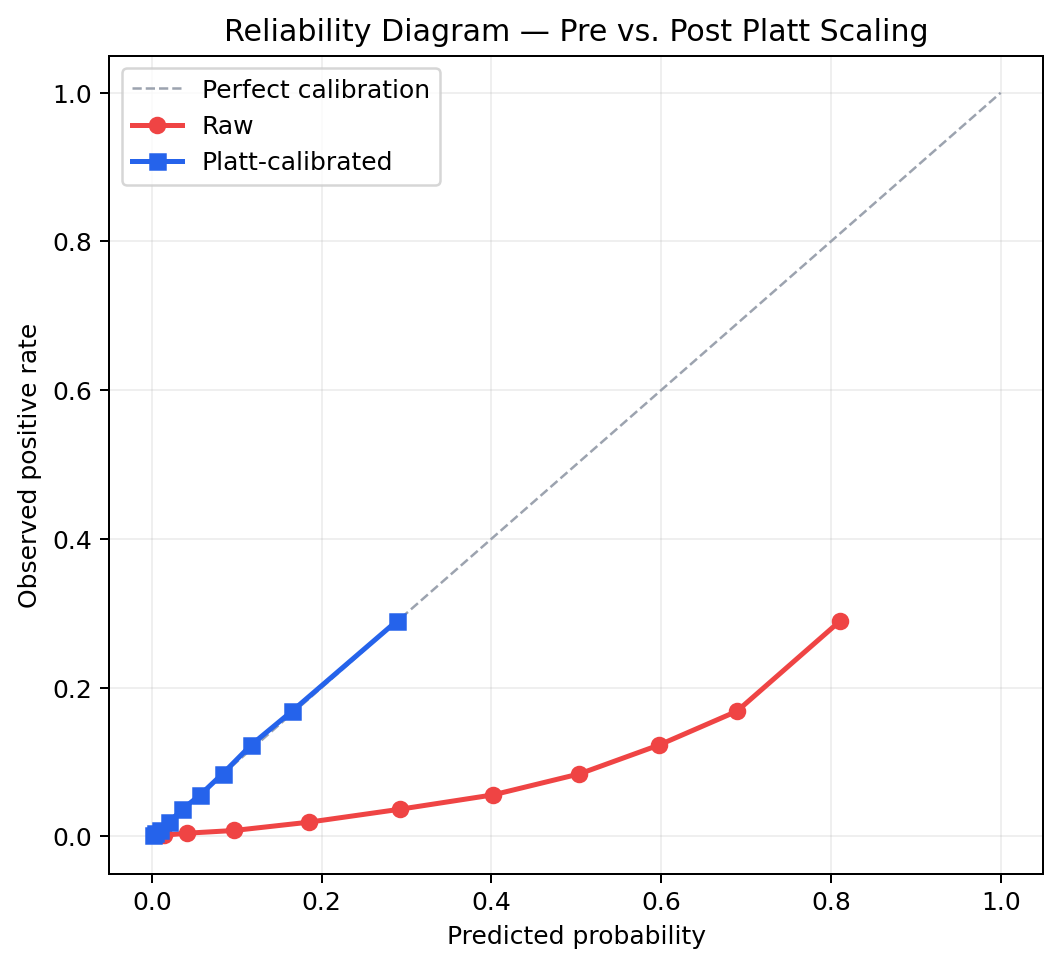
Raw CatBoost sigmoid outputs ranked well but were overconfident at low probabilities relative to the 7.9% base rate. I applied Platt scaling — a one-parameter logistic regression fit on validation-set logits — to bring the probabilities into alignment with the empirical positive rate. The operating threshold (0.066) was then tuned on the validation set to the lowest value achieving at least 85% sensitivity, reflecting the asymmetric clinical cost: a missed screen means a patient never gets an FPG ordered.
The serving layer is a FastAPI app backed by a committed model bundle (~1.6 MB:
catboost_model.cbm, calibrator.pkl, metadata.json,
global_shap.json). A vanilla-JS single-page frontend collects exam inputs, calls the API,
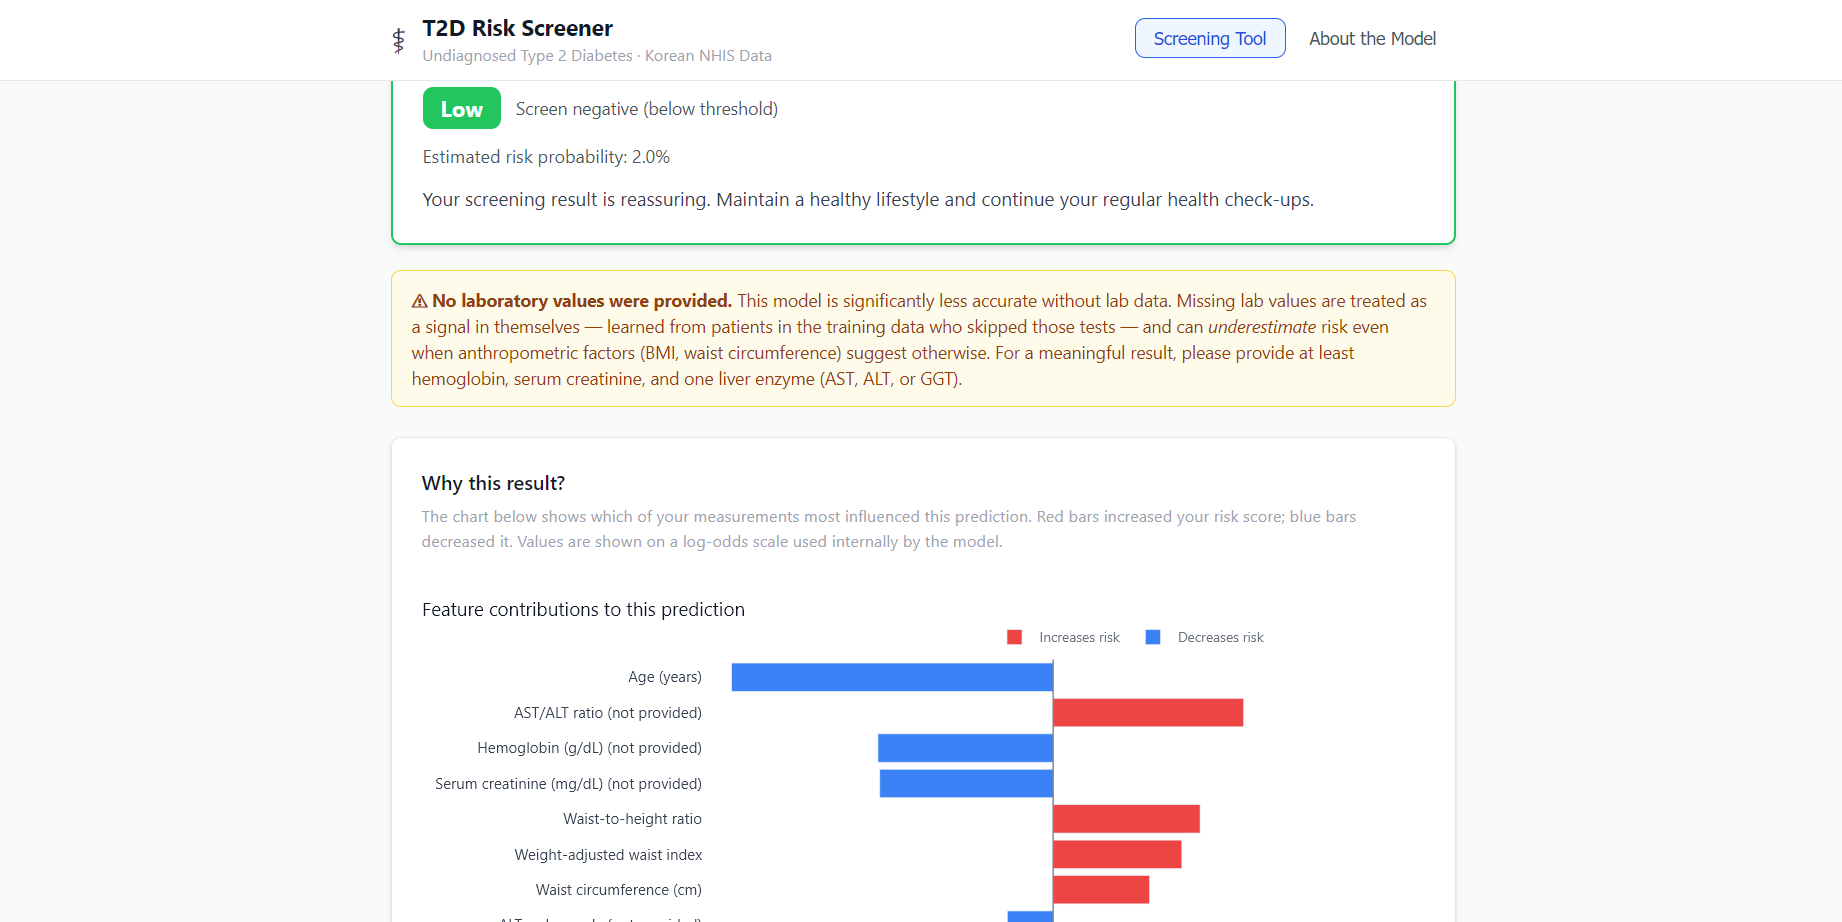
and renders the calibrated probability, risk tier, per-prediction SHAP waterfall (via Plotly), and a
matched clinical recommendation.
Results
Evaluated on the held-out 20% test slice (n ≈ 200k):
| Metric | Value |
|---|---|
| ROC-AUC | 0.816 |
| PR-AUC (Average Precision) | 0.273 |
| Brier score | 0.064 |
| Operating threshold | 0.066 (≥ 85% sensitivity) |
Key Decisions / What I Learned
Data-leakage avoidance. FPG is the quantity used to define the label
(has_diabetes = FPG ≥ 126 mg/dL). Keeping it out of the feature set was non-negotiable —
including it would make the model a trivial re-thresholding of the label, not a screener. The
interesting engineering work was building a strong signal from indirect metabolic indicators only.
Model choice as product decision. Choosing CatBoost over the tied PyTorch Tabular Net was not about leaderboard performance — the AUC difference was 0.001. It was about what the product required: fast, exact, per-prediction explanations without a GPU. In a clinical context, a black-box score without an explanation is nearly unusable.
Calibration as product thinking. A model that ranks patients correctly (good AUC) but outputs a score of 0.4 when the true base rate is 7.9% will erode clinician trust the moment they look at the numbers. Platt scaling is a small addition — one logistic regression fit on held-out logits — but it means the probability the tool displays is actually trustworthy as a probability, not just a rank.
Limitations
I want to be direct about what this project is and is not.
- Single Korean cohort, single year. All training data comes from the 2024 NHIS random sample. Performance on other populations, years, or health systems is untested.
- Label noise. FPG ≥ 126 mg/dL at one time point will misclassify some patients with known but poorly controlled T2D as "undiagnosed," because the NHIS public release does not include treatment history.
- Selection bias in optional labs. Lipid and liver-enzyme panels were ordered at clinician discretion. Patients with missing labs are on average healthier than those who were tested, so the model treats lab absence as a mild healthy signal. Submissions with all lab fields blank will likely underestimate risk; the frontend surfaces a warning in that case.
- Coarse age encoding. NHIS releases age only as 5-year bands; the model uses the band midpoint.
- Not clinically validated. This is a research portfolio project. It is not a diagnostic tool and has not undergone prospective validation.
Tech Stack
- Modeling: Python, CatBoost, scikit-learn (Platt calibration, stratified splits, evaluation)
- Explainability: SHAP (native CatBoost exact SHAP)
- API: FastAPI, Pydantic v2, Uvicorn
- Frontend: Vanilla JS, Plotly (SHAP waterfall charts)
- Data: Korean NHIS 2024 General Health Examination (data.go.kr)
Links
- GitHub: github.com/tysonjohnsondev/t2d-screener
- Live demo: tysonjohnson.dev/t2d
- Dataset: Korean NHIS 2024 General Health Examination