CountryGuesser
A fine-tuned image classifier that predicts a photo's country from street-level imagery — and beats humans by roughly 6× on the same test set.
▶ Live demo: tysonjohnson.dev/countryguesser — play the human-vs-model guessing game yourself.
At a Glance
- Domain: Computer vision — image geolocation, country-level classification (180 classes)
- Role: Solo build — model, web app, and statistical analysis are mine; the five-person human cohort were case-study participants, not collaborators (course project)
- Stack: Python, PyTorch, EfficientNet-B0, OpenStreetView-5M (OSV-5M), Flask (gunicorn) web app
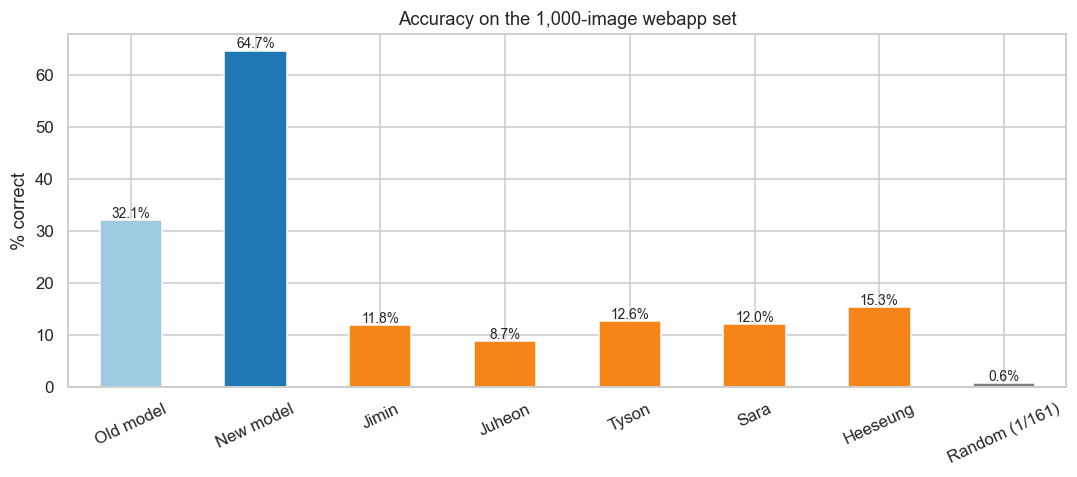
- Headline metric: 64.70% top-1 accuracy on the 1,000-image webapp benchmark vs. ~10.85% human-average — McNemar χ²=444.7, p<0.001
- Status: Complete — analysis notebook finalized April 2026; live demo deployed
Problem / Context
Given a single street-level photograph, can a model reliably identify which country it was taken in? The task is harder than it sounds: the model spans 180 possible countries, the random baseline is ~0.6% (≈1/180), and even experienced human players struggle to break 12%. I built and evaluated a deep classifier on a 500K-image subset of the OpenStreetView-5M dataset, then ran a structured human-vs-model comparison to measure where the model outperforms people and, more usefully, where it fails.
Approach
I fine-tuned an EfficientNet-B0 backbone on 500K images drawn from OSV-5M, treating country-level prediction as a 180-class classification problem. EfficientNet-B0 was chosen for its favorable accuracy-to-parameter-count ratio — large enough to learn country-level visual cues (vegetation, road markings, signage style, terrain), compact enough to train on the available hardware budget. Training ran on Google Colab (NVIDIA A100) for 6 epochs at batch size 32 — roughly 4.7 hours of wall-clock time.
To measure progress rigorously, I kept a held-out test split separate from the validation set. An early checkpoint (the "old model") was already deployed to a webapp when I recruited case-study participants; the final fine-tuned checkpoint (the "new model") was later re-scored on the exact same 1,000 webapp images, giving a clean paired comparison with no data leakage between the two model evaluations.
For the human-vs-model analysis I built a Python notebook (April 2026) that ingested 2,034 human guesses across the 1,000 images alongside both model predictions. I used McNemar's test throughout — the right choice for paired binary outcomes — to quantify improvement from old to new checkpoint, and then to compare the new model against human performance.
Results
| Benchmark | Accuracy |
|---|---|
| Random baseline (1/180) | ~0.6% |
| Old model checkpoint (1,000-image webapp set) | 32.10% |
| New model — held-out test split (general) | 57.6% |
| New model — 1,000-image webapp benchmark | 64.70% |
| Validation top-1 | 75.0% |
| Human average (5-person case-study cohort) | ~10.85% |
Model vs. old checkpoint: +32.6 pp improvement on the same 1,000 images (McNemar χ²=272.5, p<0.001).
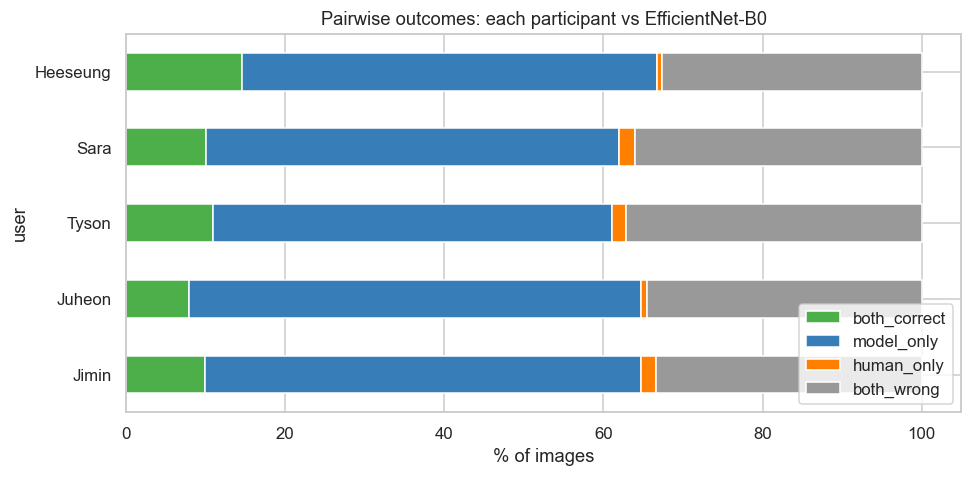
Model vs. humans: McNemar χ²=444.7, p<0.001 (any-human-correct vs. new model). On the 1,000-image set the model is roughly 6× the human average.
Key Decisions / What I Learned
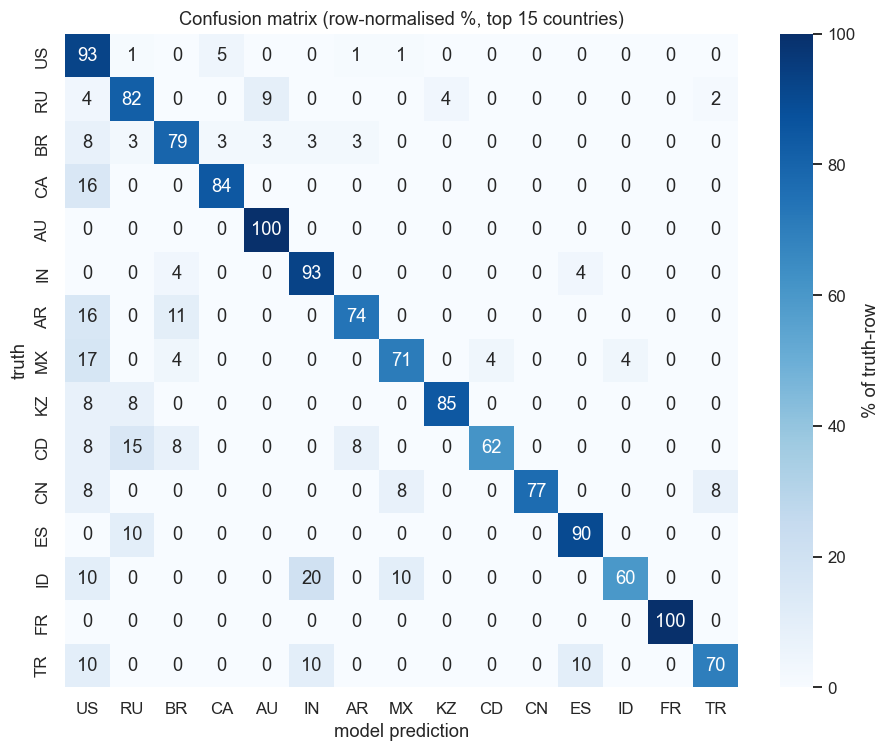
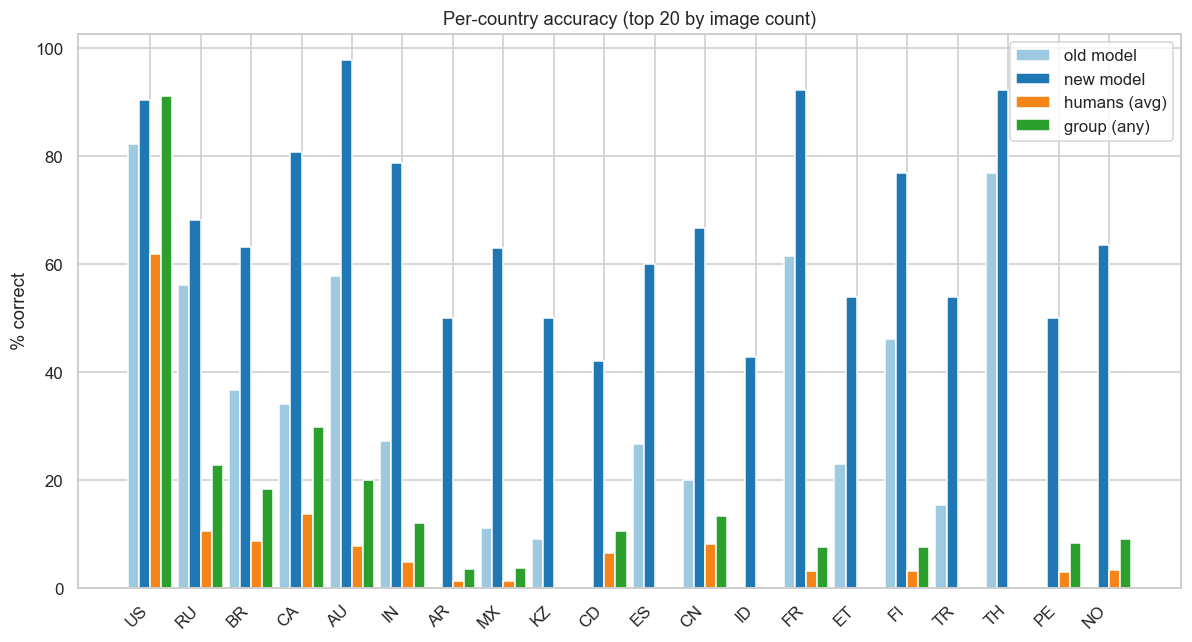
The US/Canada confusion is the signature failure mode. The model predicts US or Canada for 80.9% of Canada's images in the benchmark. Of the 22 images where a human beat the model, 7 are US↔Canada flips — cases where a human recognized a Canadian-specific cue (a sign font, a license plate style) that the model collapsed into a shared North American visual space. This tells me the model learned region-level priors but not the fine-grained discriminative features that separate visually similar neighbors.
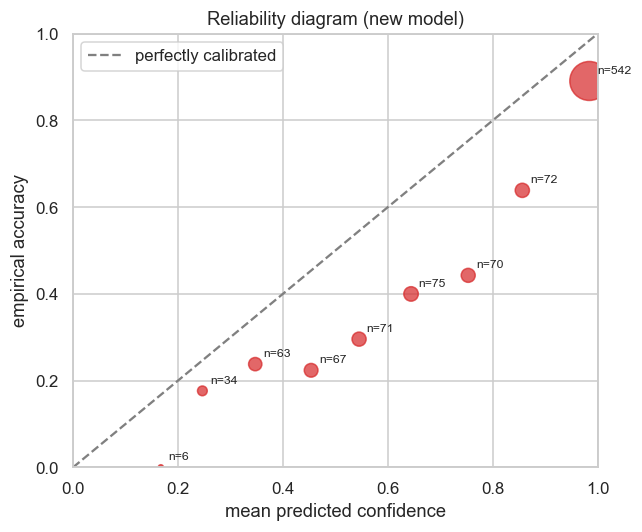
The model is overconfident, and I can measure by how much. In the top softmax bin (0.9–1.0, n=542 images) empirical accuracy is ~89% while mean predicted confidence is ~98%. The reliability diagram sits clearly below the diagonal at high confidence. This is a known artifact of softmax classifiers on multi-class problems and matters if the output score is ever used as a decision threshold — which is why I charted it explicitly rather than just reporting top-1.
Humans and the model share the same difficulty structure. Observed human-only wins are well below what independence would predict (Jimin: 19 observed vs. 41.7 expected; Juheon: 8 observed vs. 30.7 expected). The two are positively correlated on image difficulty. Humans beat the model mainly on images with strong cultural priors — a US stop sign, a recognizable license plate — not by having a generally different visual understanding of the world.
McNemar's, not Wilcoxon. All statistical comparisons here use McNemar's paired-proportion test, which is appropriate for paired binary correctness outcomes. An earlier version of my resume cited a Wilcoxon test; that was incorrect and is not what this notebook runs.
Limitations
- The gap between val (75.0%) and test (57.6%) is real. Roughly 17 percentage points of generalization loss is meaningful and likely reflects distribution shift within OSV-5M — the val and test splits may not be equally representative across countries and capture conditions. I'd want to audit per-country image counts before claiming production readiness.
- The human cohort is small. Three case-study participants (n=34 to n=1,000 guesses each) is enough for statistical significance given the effect size, but the human average could shift with a larger or more geographically diverse group of players.
- Overconfidence is uncorrected. The softmax output is not calibrated. A temperature scaling step post-training would bring the reliability diagram closer to the diagonal and make the confidence score more trustworthy.
- Class imbalance in OSV-5M. Countries with fewer street-level images in the dataset (e.g., CD, ET) have substantially lower model accuracy. Performance is heavily skewed toward data-rich countries (US: ~90%, AU: ~98%).
- Country-level is a coarse target. Predicting country from an image is an interesting benchmark but the practical geolocation use case usually requires finer resolution. This project does not address city or coordinate-level prediction.
- The webapp's answer dropdown lists only 161 countries. That cap is a legacy constraint from the older deployed model and is a UI artifact, not the model's class count — the committed model classifies all 180 trained countries. In practice only 120 of those 180 appear as ground-truth answers in the 1,000-image benchmark, and 19 of the trained countries are never selectable as a human's guess.
Tech Stack
- Modeling: Python, PyTorch, EfficientNet-B0 (fine-tuned), torchvision
- Data: OpenStreetView-5M (OSV-5M), 500K-image training subset
- Analysis: pandas, NumPy, matplotlib, seaborn, SciPy (McNemar's test)
- Webapp / data collection: Flask (gunicorn), Leaflet map frontend, SQLite guess logging
- Environment: Google Colab (NVIDIA A100) for training; RackNerd VPS (Apache + Cloudflare) for the live demo
Links
- Live demo: tysonjohnson.dev/countryguesser
- GitHub: github.com/tysonjohnsondev/geolocation-project
- Analysis notebook:
human_vs_model_analysis.pdf(April 14, 2026) — available on request - Dataset: OpenStreetView-5M